
Intro
Understand normal body temperature ranges with our comprehensive Body Temperature Chart Guide, covering fever, hypothermia, and temperature regulation, to help you monitor health and detect anomalies.
Maintaining an optimal body temperature is crucial for overall health and well-being. The human body operates within a narrow temperature range, and any significant deviations can lead to discomfort, illness, or even life-threatening conditions. A body temperature chart is an essential tool for monitoring and understanding the body's thermal dynamics. In this article, we will delve into the world of body temperature, exploring its importance, the benefits of monitoring it, and providing a comprehensive guide to creating and using a body temperature chart.
The human body's normal temperature range is between 97.7°F (36.5°C) and 99.5°F (37.5°C). However, this range can vary slightly from person to person, depending on factors such as age, sex, and physical activity level. Monitoring body temperature can help identify potential health issues, such as infections, inflammation, or hormonal imbalances. Moreover, tracking body temperature can provide valuable insights into the body's response to various stimuli, including medication, exercise, and environmental changes.
Body temperature is regulated by the hypothalamus, a small region in the brain that acts as the body's thermostat. The hypothalamus receives feedback from temperature sensors throughout the body and adjusts heat production and loss to maintain a stable internal temperature. This complex process involves the coordination of multiple physiological mechanisms, including sweating, shivering, and vasodilation. By monitoring body temperature, individuals can gain a deeper understanding of their body's thermoregulatory processes and take proactive steps to maintain optimal health.
Understanding Body Temperature Ranges

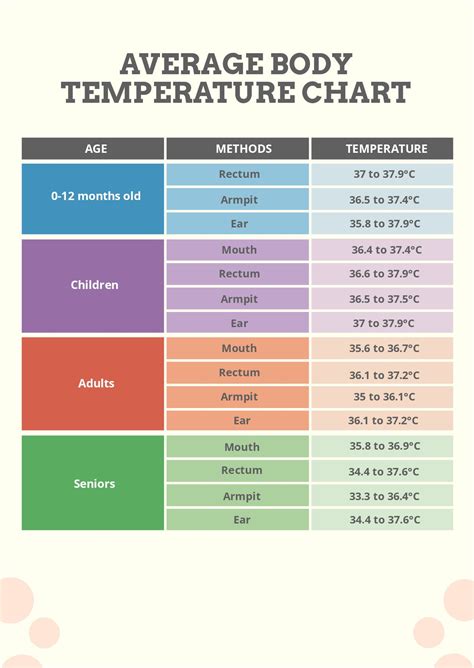
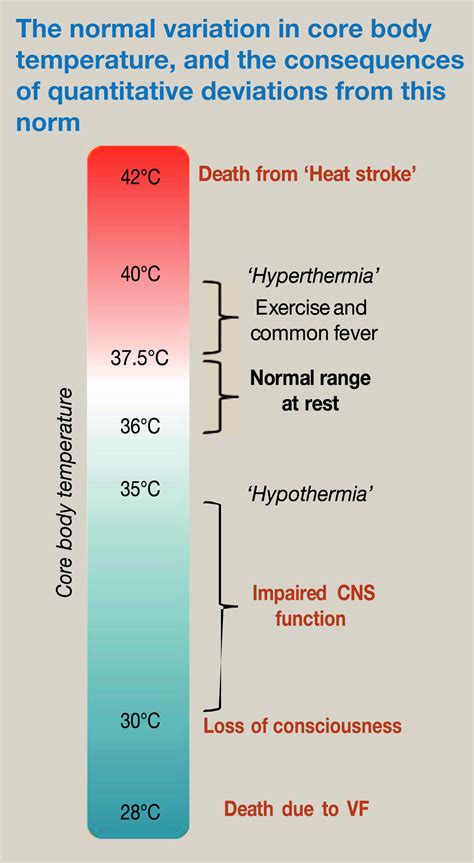
Body temperature can be categorized into several ranges, each with distinct characteristics and implications for health. The normal temperature range is between 97.7°F (36.5°C) and 99.5°F (37.5°C). A temperature above 100.4°F (38°C) is considered feverish, while a temperature below 95°F (35°C) is considered hypothermic. Understanding these ranges is essential for interpreting body temperature data and making informed decisions about health.
Normal Body Temperature Range
The normal body temperature range is between 97.7°F (36.5°C) and 99.5°F (37.5°C). This range is considered optimal for most bodily functions, including metabolic processes, immune function, and cognitive performance. Maintaining a temperature within this range is crucial for overall health and well-being.Feverish Body Temperature Range
A body temperature above 100.4°F (38°C) is considered feverish. Fever is a common symptom of infection or inflammation, and it can be caused by a variety of factors, including bacterial or viral infections, autoimmune disorders, or environmental toxins. Monitoring body temperature can help identify feverish conditions and prompt medical attention if necessary.Hypothermic Body Temperature Range
A body temperature below 95°F (35°C) is considered hypothermic. Hypothermia can be caused by exposure to cold environments, certain medical conditions, or the use of certain medications. Monitoring body temperature can help identify hypothermic conditions and prompt medical attention if necessary.Creating a Body Temperature Chart
Creating a body temperature chart is a simple and effective way to monitor and track body temperature over time. Here are the steps to create a basic body temperature chart:
- Choose a format: Decide on a format for your chart, such as a table or graph. You can use a spreadsheet program or a dedicated charting app to create your chart.
- Set a schedule: Determine how often you want to take your temperature, such as daily or weekly. Consistency is key to accurate tracking.
- Use a thermometer: Choose a reliable thermometer, such as a digital or mercury thermometer. Make sure to follow the manufacturer's instructions for use.
- Record data: Take your temperature at the scheduled time and record the data in your chart. Include the date, time, and temperature reading.
- Analyze data: Review your chart regularly to identify patterns, trends, or anomalies. Look for changes in temperature over time or in response to specific stimuli.
Benefits of Using a Body Temperature Chart
Using a body temperature chart can provide numerous benefits, including:- Improved health monitoring: Tracking body temperature can help identify potential health issues, such as infections or hormonal imbalances.
- Enhanced self-awareness: Monitoring body temperature can provide valuable insights into the body's response to various stimuli, including medication, exercise, and environmental changes.
- Personalized health planning: By analyzing body temperature data, individuals can make informed decisions about their health and develop personalized plans for maintaining optimal wellness.
Interpreting Body Temperature Data
Interpreting body temperature data requires a basic understanding of thermoregulatory physiology and the factors that influence body temperature. Here are some tips for interpreting body temperature data:
- Look for patterns: Identify patterns or trends in your temperature data, such as changes in temperature over time or in response to specific stimuli.
- Consider contextual factors: Take into account contextual factors that may influence body temperature, such as environmental temperature, physical activity level, or medication use.
- Consult a healthcare professional: If you notice any unusual or concerning patterns in your temperature data, consult a healthcare professional for guidance and support.
Common Factors that Influence Body Temperature
Several factors can influence body temperature, including:- Environmental temperature: Exposure to hot or cold environments can affect body temperature.
- Physical activity level: Increased physical activity can raise body temperature, while decreased activity can lower it.
- Medication use: Certain medications, such as antipyretics or anesthetics, can influence body temperature.
- Hormonal changes: Hormonal fluctuations, such as those experienced during menstruation or menopause, can affect body temperature.
Practical Applications of Body Temperature Charts
Body temperature charts have numerous practical applications, including:
- Health monitoring: Tracking body temperature can help identify potential health issues, such as infections or hormonal imbalances.
- Fertility planning: Monitoring body temperature can help individuals plan for fertility, as basal body temperature can indicate ovulation.
- Athletic performance: Athletes can use body temperature charts to optimize their performance, as changes in temperature can affect physical performance and recovery.
- Medical research: Body temperature charts can provide valuable data for medical research, particularly in the fields of thermoregulatory physiology and infectious disease.
Real-World Examples of Body Temperature Charts
Here are some real-world examples of body temperature charts:- Fertility charting: A woman uses a body temperature chart to track her basal body temperature and identify ovulation, helping her plan for conception.
- Athletic performance monitoring: An athlete uses a body temperature chart to monitor their temperature during training and competition, adjusting their strategy to optimize performance and recovery.
- Medical research: A researcher uses body temperature charts to study the effects of a new medication on thermoregulatory physiology, providing valuable insights for future medical applications.
What is a normal body temperature range?
+A normal body temperature range is between 97.7°F (36.5°C) and 99.5°F (37.5°C).
How often should I take my temperature?
+The frequency of temperature taking depends on individual needs and circumstances. Generally, taking temperature daily or weekly can provide valuable insights into thermoregulatory processes.
What factors can influence body temperature?
+Several factors can influence body temperature, including environmental temperature, physical activity level, medication use, and hormonal changes.
In summary, understanding body temperature and using a body temperature chart can provide valuable insights into overall health and well-being. By monitoring body temperature, individuals can identify potential health issues, optimize physical performance, and make informed decisions about their health. We invite you to share your thoughts and experiences with body temperature charts in the comments below. Have you used a body temperature chart to monitor your health or optimize your performance? What benefits or challenges have you encountered? Join the conversation and let's explore the world of body temperature together!