
Intro
Manage diabetes with a blood sugar chart, tracking glucose levels, insulin resistance, and healthy range targets to control symptoms and prevent complications, using a diabetes log to monitor progress.
Maintaining healthy blood sugar levels is crucial for individuals with diabetes. A diabetes blood sugar chart is an essential tool that helps track and manage blood glucose levels. Understanding the importance of monitoring blood sugar levels and using a diabetes blood sugar chart can significantly improve the quality of life for individuals with diabetes. In this article, we will delve into the world of diabetes management, exploring the benefits of using a diabetes blood sugar chart, how it works, and providing practical examples to help individuals with diabetes take control of their condition.
Regular monitoring of blood sugar levels helps individuals with diabetes make informed decisions about their diet, exercise, and medication. By tracking blood glucose levels, individuals can identify patterns and trends, allowing them to adjust their treatment plan accordingly. A diabetes blood sugar chart is a simple yet effective way to monitor blood sugar levels, providing a clear and concise visual representation of blood glucose levels over time. This information can be used to make adjustments to diet, exercise, and medication, helping to maintain healthy blood sugar levels and prevent complications associated with diabetes.
The importance of using a diabetes blood sugar chart cannot be overstated. By monitoring blood sugar levels, individuals with diabetes can reduce the risk of complications such as heart disease, kidney damage, and nerve damage. Additionally, tracking blood glucose levels can help individuals identify potential issues before they become serious, allowing for prompt intervention and treatment. With the help of a diabetes blood sugar chart, individuals with diabetes can take control of their condition, making informed decisions about their health and well-being.
Understanding Blood Sugar Levels
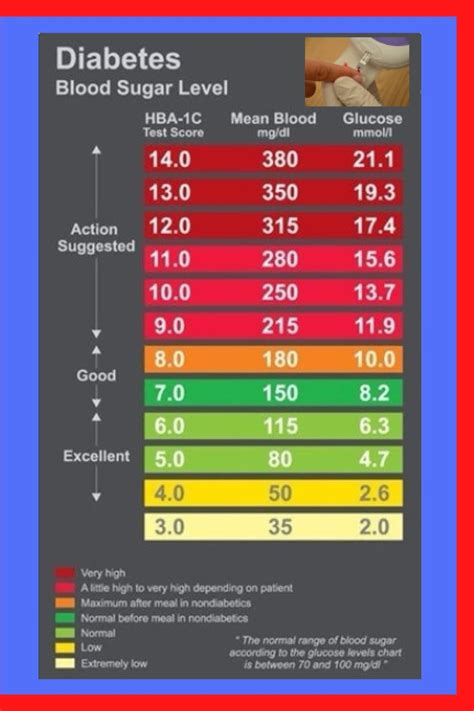
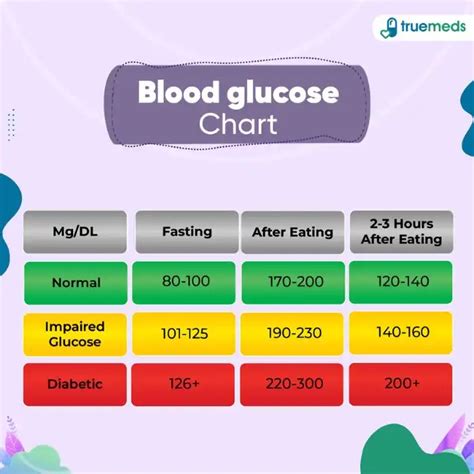
Understanding blood sugar levels is crucial for effective diabetes management. Blood sugar levels are measured in milligrams per deciliter (mg/dL) and are typically categorized into several ranges. Normal blood sugar levels are typically between 70 and 140 mg/dL, while levels above 140 mg/dL may indicate hyperglycemia (high blood sugar). Conversely, levels below 70 mg/dL may indicate hypoglycemia (low blood sugar). By understanding these ranges, individuals with diabetes can make informed decisions about their treatment plan, adjusting their diet, exercise, and medication as needed.
Normal Blood Sugar Levels
Normal blood sugar levels vary throughout the day, typically ranging from 70 to 140 mg/dL. Fasting blood sugar levels (measured after an overnight fast) are typically between 70 and 100 mg/dL, while postprandial blood sugar levels (measured after eating) are typically between 100 and 140 mg/dL. Understanding these ranges is essential for effective diabetes management, allowing individuals to adjust their treatment plan accordingly.Creating a Diabetes Blood Sugar Chart

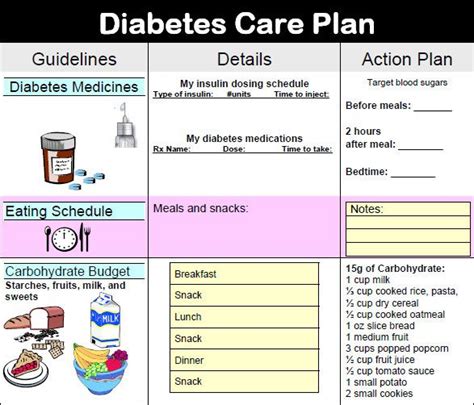
Creating a diabetes blood sugar chart is a simple and effective way to track blood glucose levels. A typical chart includes columns for date, time, blood sugar level, medication, and notes. By tracking this information, individuals with diabetes can identify patterns and trends, allowing them to adjust their treatment plan accordingly. For example, an individual may notice that their blood sugar levels are consistently high after breakfast, indicating the need for a medication adjustment or dietary change.
Using a Diabetes Blood Sugar Chart
Using a diabetes blood sugar chart is a straightforward process. Simply record blood glucose levels at regular intervals (typically before meals and before bed), noting any medication taken and any notable events (such as exercise or illness). By tracking this information, individuals with diabetes can identify patterns and trends, allowing them to make informed decisions about their treatment plan. For example, an individual may notice that their blood sugar levels are consistently low after exercise, indicating the need for a snack or medication adjustment.Benefits of Using a Diabetes Blood Sugar Chart
The benefits of using a diabetes blood sugar chart are numerous. By tracking blood glucose levels, individuals with diabetes can:
- Identify patterns and trends, allowing for adjustments to their treatment plan
- Monitor the effectiveness of medication and make adjustments as needed
- Track the impact of diet and exercise on blood sugar levels
- Identify potential issues before they become serious, allowing for prompt intervention and treatment
- Take control of their condition, making informed decisions about their health and well-being
Practical Examples
Practical examples of using a diabetes blood sugar chart include: * Tracking blood glucose levels before and after meals to identify patterns and trends * Monitoring the impact of exercise on blood sugar levels, adjusting medication or diet as needed * Identifying potential issues, such as consistently high or low blood sugar levels, and making adjustments to the treatment plan accordingly * Using the chart to communicate with healthcare providers, ensuring that treatment plans are tailored to individual needsCommon Mistakes to Avoid
When using a diabetes blood sugar chart, there are several common mistakes to avoid. These include:
- Failing to track blood glucose levels regularly, making it difficult to identify patterns and trends
- Not recording medication or notable events, making it challenging to understand the impact of these factors on blood sugar levels
- Not reviewing the chart regularly, missing opportunities to adjust the treatment plan and improve diabetes management
- Not communicating with healthcare providers, ensuring that treatment plans are tailored to individual needs
Best Practices
Best practices for using a diabetes blood sugar chart include: * Tracking blood glucose levels at regular intervals (typically before meals and before bed) * Recording medication and notable events (such as exercise or illness) * Reviewing the chart regularly to identify patterns and trends * Communicating with healthcare providers to ensure that treatment plans are tailored to individual needsConclusion and Next Steps
In conclusion, a diabetes blood sugar chart is a powerful tool for managing diabetes. By tracking blood glucose levels, individuals with diabetes can identify patterns and trends, making informed decisions about their treatment plan. By following best practices and avoiding common mistakes, individuals can take control of their condition, improving their overall health and well-being. We encourage readers to share their experiences with using a diabetes blood sugar chart, asking questions or seeking guidance on how to effectively manage their diabetes.
What is a normal blood sugar level?
+Normal blood sugar levels are typically between 70 and 140 mg/dL.
How often should I track my blood sugar levels?
+It is recommended to track blood sugar levels at regular intervals, typically before meals and before bed.
What are the benefits of using a diabetes blood sugar chart?
+The benefits of using a diabetes blood sugar chart include identifying patterns and trends, monitoring the effectiveness of medication, and taking control of your condition.